Settings
The Settings screen is reached via the gear icon in the navigation sidebar. It is organised into three tabs.
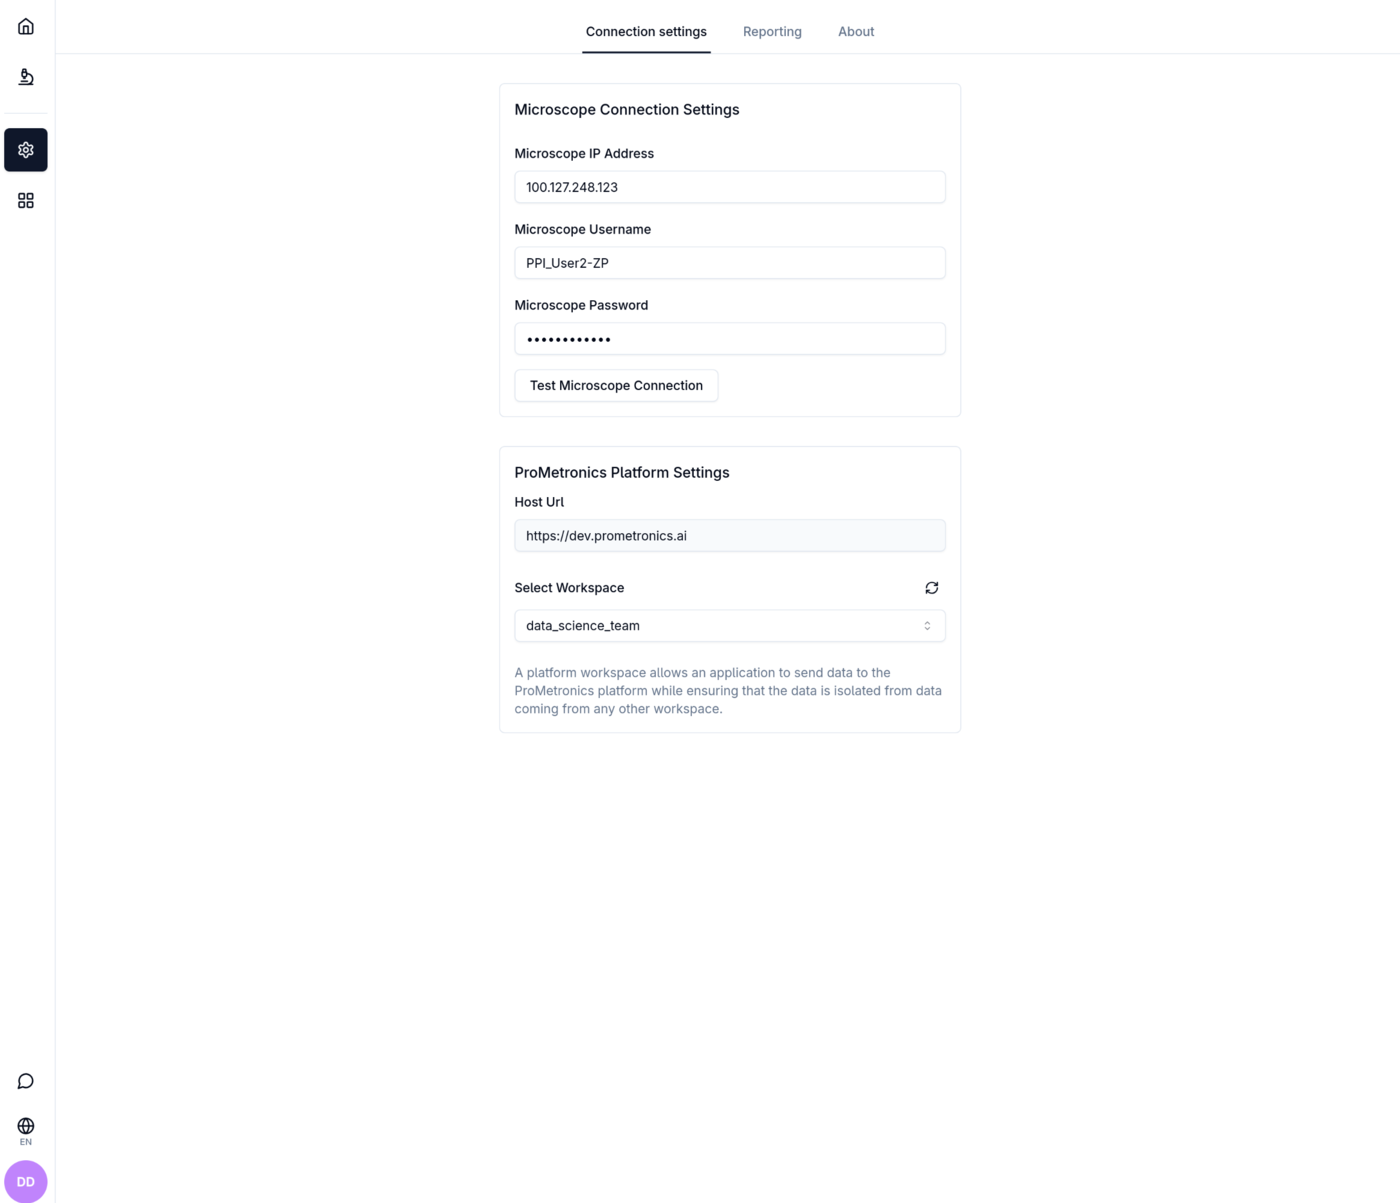
Connection settings
Microscope Connection Settings
| Field | Description |
|---|---|
| Microscope IP Address | IP address of the SEM/microscope control computer |
| Microscope Username | Login username for the microscope software |
| Microscope Password | Login password for the microscope software |
Click Test Microscope Connection to verify the credentials without leaving the screen. An animated indicator appears next to the button:
- Spinning blue loader — test in progress
- Green checkmark — connection successful
- Red X — connection failed
ProMetronics Platform Settings
| Field | Description |
|---|---|
| Host Url | URL of the ProMetronics platform (read-only) |
| Select Workspace | The platform workspace capture data is sent to. Click the refresh icon next to the label to reload the workspace list. |
A workspace isolates captured data from other workspaces on the same platform instance. If the workspace list fails to load, an error card is shown with the reason.
Reporting
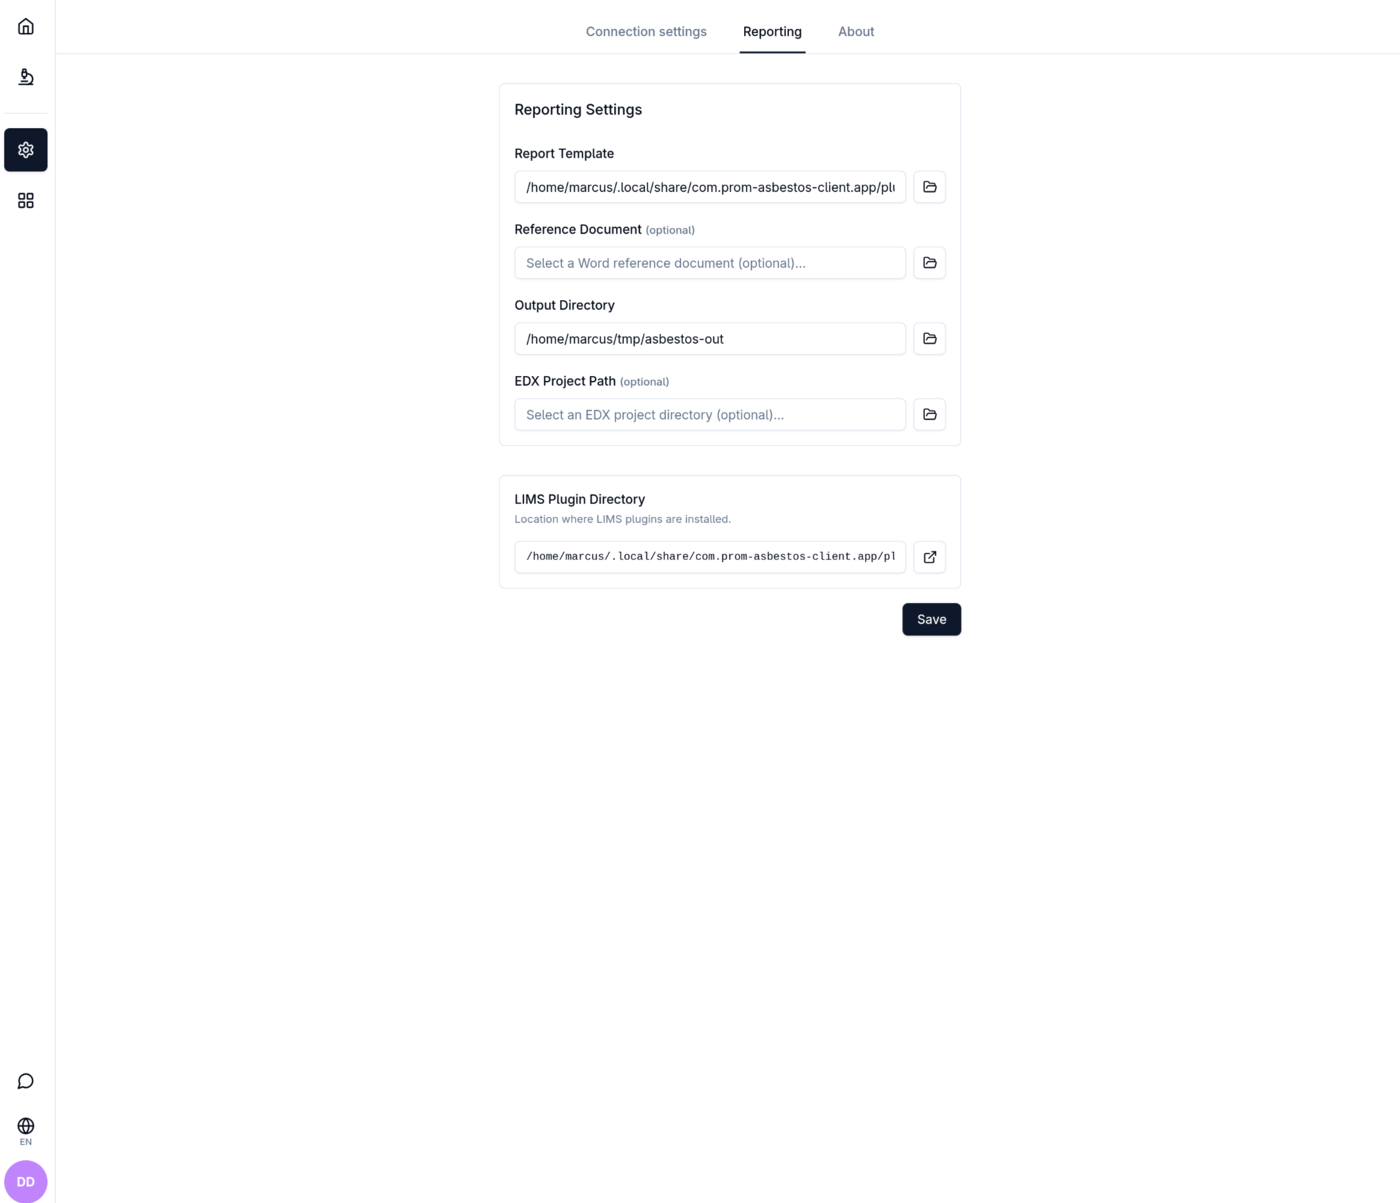
The Reporting tab configures paths used when generating analysis reports. Changes are saved with the Save button below the LIMS Plugin Directory section.
Reporting Settings
| Field | Description |
|---|---|
| Report Template | Path to the HTML/Jinja2 report template file (.html or .j2). Use the folder icon to browse. |
| Reference Document (optional) | Path to a .docx Word reference document used to apply styles to the generated report. Use the folder icon to browse; the field can be left empty. |
| Output Directory | Folder where generated reports are saved. Use the folder icon to browse. |
| EDX Project Path (optional) | Path to the EDX project directory for spectral data integration. Use the folder icon to browse; the field can be left empty. |
LIMS Plugin Directory
Displays the read-only installation path of the LIMS plugins ("Location where LIMS plugins are installed."). Click the external link icon to reveal the folder in the system file explorer.
About
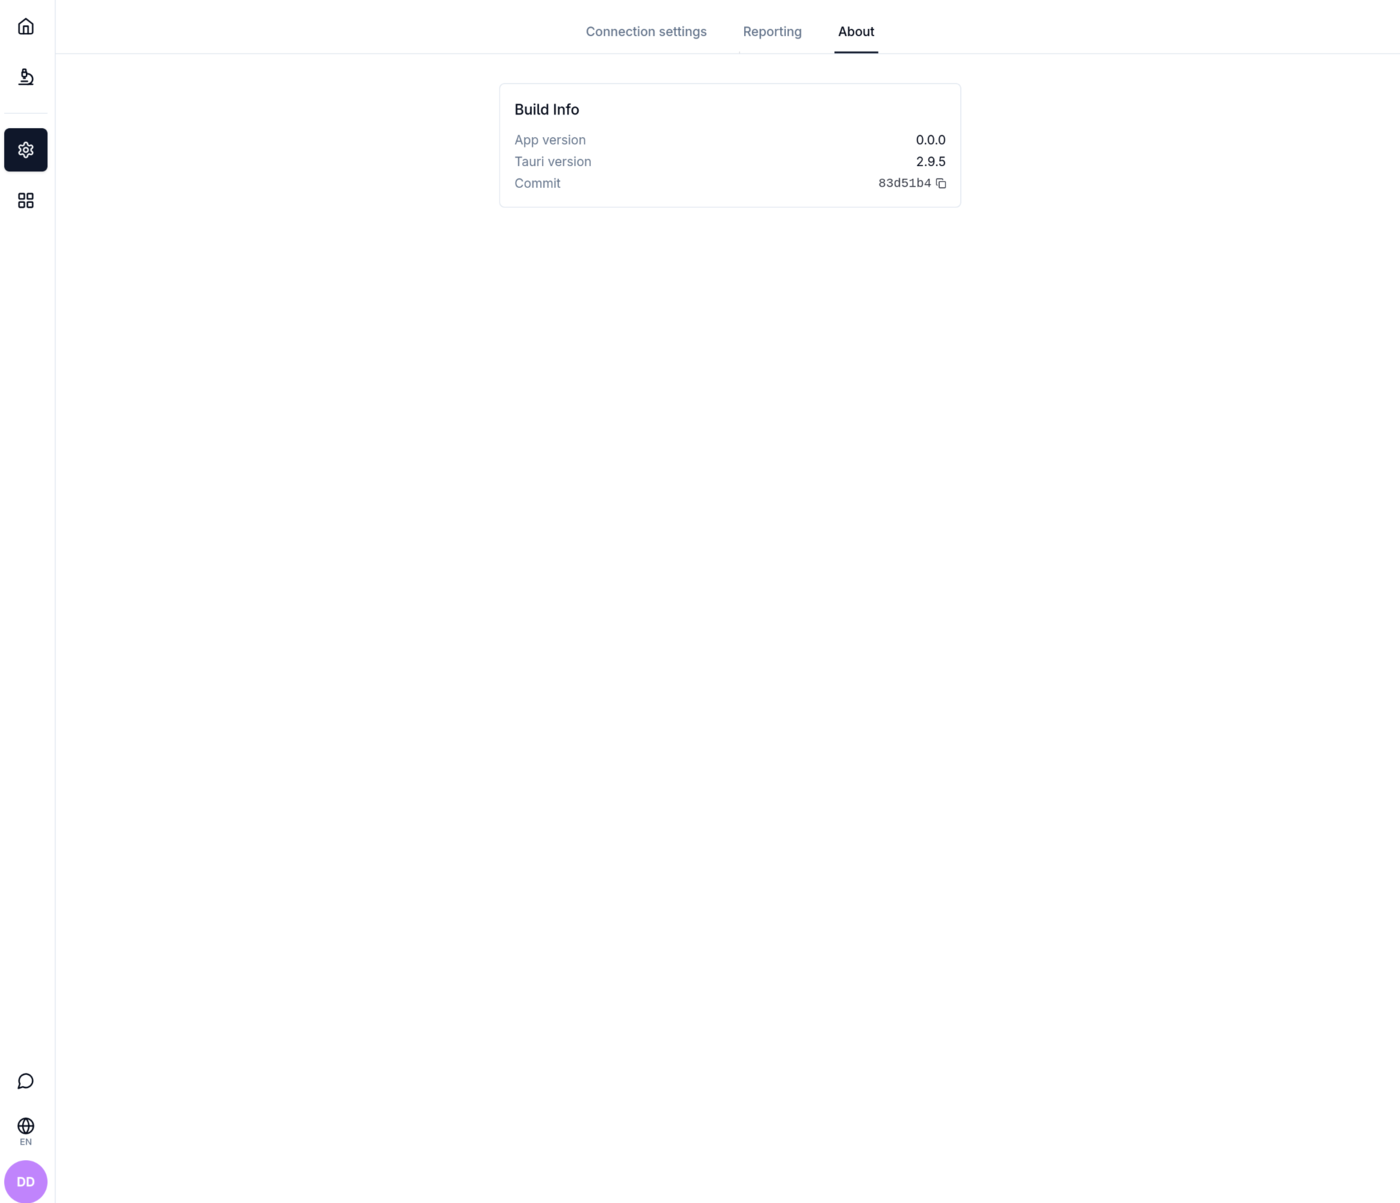
The About tab shows a Build Info card with version details for the currently installed app:
| Field | Description |
|---|---|
| App version | Semantic version of the Asbest Scan App |
| Tauri version | Version of the Tauri runtime the app was built with |
| Commit | Short git commit hash of the build. Click the copy icon next to the value to copy the full hash to the clipboard. |